How should the APOG historical PE ratio be determined?
Realizing that PE stands for Price to Earnings ratio, we need two values to compute it: stock price and earnings per share. The stock price at any given date is a known historical value, but what about the earnings number to use?
✔️Accepted answer:
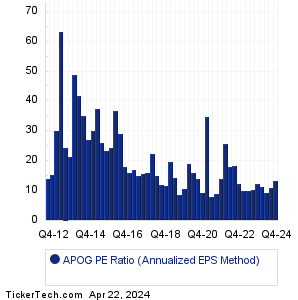
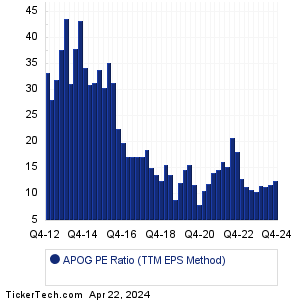
There are a number of different approaches when it comes to calculating a historical PE ratio for a company like Apogee Enterprises. We like to take our measurements on each of the past quarterly earnings reports. That only leaves the question of whether the earnings number at that quarterly report should be used on an annualized basis, or some other method. We approach this question using three different methods, on this APOG Historical PE Ratio page.
What is the average historical PE for APOG based on annualized quarterly earnings?
As we look back through earnings history, what is the resulting PE calculation if at each measurement period we use that quarter's earnings result annualized?
✔️Accepted answer:
The APOG historical PE ratio using the annualized quarterly earnings method works out to 20.1.
What is the average historical PE for APOG based on trailing twelve month earnings?
As we look back through earnings history, what is the resulting PE calculation if at each measurement period we use the trailing twelve months combined earnings result in the calculation?
✔️Accepted answer:
The APOG historical PE ratio using the TTM earnings method works out to 20.4.
What is the average historical PE for APOG based on median TTM earnings?
As we look back through earnings history, what is the resulting PE calculation if at each measurement period we use the median earnings over the trailing twelve months and annualize that median result in the calculation?
✔️Accepted answer:
The APOG historical PE ratio using the annualized median TTM earnings method works out to 4.76.
On this page we presented the
APOG Historical PE Ratio information for Apogee Enterprises' stock.
The average APOG historical PE based on using the annualized quarterly earnings result at each measurement period (for the "E" in the PE calculation; and the closing price on earnings date as the "P") is 20.1. Meanwhile, using the trailing twelve month (TTM) quarterly earnings result as our method of calculation the "E" value at each measurement period, the average APOG historical PE based on this TTM earnings result method is 20.4. Note: any PE calculations involving negative earnings were discarded as not meaningful.
Let's now compare this APOG historical PE result, against the recent PE: when this page was posted on 4/19/2024, the most recent closing price for APOG had been 57.95, and the most recent quarterly earnings result, annualized, was 4.56. Meanwhile, the most recent TTM earnings summed to 4.78. From these numbers, we calculate the recent APOG PE on 4/19/2024 based on annualized quarterly EPS was 12.7. Based on APOG's history, that recent PE is low relative to the historical average, with the recent PE 36.8% lower than the historical average PE across our data set for Apogee Enterprises. Looking at the recent APOG PE on 4/19/2024 based on TTM EPS, we calculate the ratio at 12.1. Based on APOG's history, that recent PE is low relative to the historical average, with the recent PE 40.7% lower than the average PE across our Apogee Enterprises data set with TTM EPS used in the calculation at each period.
Another interesting APOG historical PE Ratio calculation we look at is to take the
median earnings per share of the last four quarters for APOG, and then annualize the resulting value... with that annualized number then being used in the PE calculation. To walk through this math for APOG, we start with the past four EPS numbers and we first sort them from lowest to highest: 1.05, 1.14, 1.23, and 1.36. We then toss out the highest and lowest result, and then take the average of those two middle numbers — 1.14 and 1.23 — which gives us the median of 1.19. Basically the way to think about this 1.19 number is this: for the trailing four earnings reports, 1.19 marks the "middle ground" number where APOG has reported a value
higher than 1.19 half the time, and has reported a value
lower than 1.19 half the time. Annualizing that median value then gets us to 4.76/share, which we use as the denominator in our next PE calculation. With 57.95 as the numerator (as of 4/19/2024), the calculation is then 57.95 / 4.76 =
12.2 as the APOG PE ratio as of 4/19/2024, based on that annualized median value we calculated.
For self directed investors doing their due diligence on APOG or any other given stock, valuation analysis for APOG
can greatly benefit from studying the past earnings and resulting PE calculations. This exercise can help inform an analysis
as to whether the past earnings trajectory and current versus historical PE ratios justify the current stock value.
That's why we bring you
HistoricalPERatio.com to make it easy for investors to investigate
Apogee Enterprises PE history or the past PE information for any stock in our coverage universe.
And in your continued research we hope you will be sure to check out the further links included for earnings
surprises history (beat/miss data) as well as next earnings dates for APOG. Thanks for visiting, and the next
time you need to research
APOG Historical PE Ratio or the ratio for another stock, we hope you'll think of our site, as your
go-to historical PE ratio research resource of choice.

 This APOG PE ratio history page last updated 4/22/2024

 Free APOG Email Alerts:

