
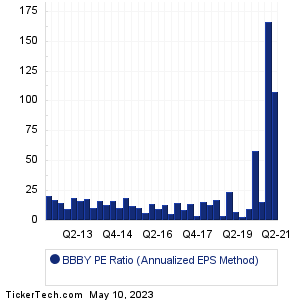
BBBY Historical PE Ratio image Bed Bath & Beyond Historical PE Ratio

This BBBY historical PE ratio page, which was last updated 8/17/2026, presents historical price to earnings information for Bed Bath & Beyond under both the TTM method and the annualized method, and presented in both tabular and graphical format for ease of study.

BBBY Historical PE Ratio Notes

— Bed Bath & Beyond (ticker symbol BBBY) was a well-known American retailer specializing in home goods, including bedding, bath products, kitchenware, and home d�e9cor. Founded in 1971, the company operated hundreds of stores across the U.S., and at its peak, was considered a leader in the specialty home retail space. Over the years, BBBY's business model faced significant headwinds from growing e-commerce competition, changing consumer preferences, and operational challenges. When researching BBBY's historical price-to-earnings (PE) ratio, note that the ratio reflects the market's expectations for future earnings as well as the company's actual profit performance. During periods of strong sales and profitability, the PE ratio might have been lower, indicating solid earnings relative to price, or higher, if investors anticipated even more growth. However, as sales stalled, profit margins shrank, and losses mounted, the PE ratio could become elevated or even unavailable (if net earnings turned negative), signaling investor concern and shrinking confidence in future performance. Understanding BBBY's underlying business health during each period you analyze will help you interpret the shifting PE ratios you see in historical charts & tables.
BBBY Historical PE Ratio Chart
PeriodPriceAdj. EPSAnnualizedPE
Q2 2026
8/4/2026
5.56-0.53-2.12NA
Q1 2026
4/27/2026
5.34-0.25-1.00NA
Q4 2025
2/23/2026
5.07-0.16-0.64NA
Q3 2025
10/27/2025
8.60-0.19-0.76NA
Q2 2025
7/28/2025
10.30-0.22-0.88NA
Q1 2025
4/28/2025
4.18-0.42-1.68NA
Q4 2024
2/24/2025
6.92-0.91-3.64NA
Q3 2024
10/24/2024
6.69-0.96-3.84NA
Q2 2024
7/29/2024
13.59-0.76-3.04NA
Q1 2024
5/6/2024
21.89-1.22-4.88NA
Q4 2023
2/20/2024
27.18-1.22-4.88NA
Q3 2023
10/26/2023
15.40-0.61-2.44NA
Q2 2023
7/27/2023
35.02-0.02-0.08NA
Q1 2023
4/27/2023
20.13-0.10-0.40NA
Q4 2022
2/22/2023
20.53-0.04-0.16NA
Q3 2022
1/10/2023
20.16-3.65-14.60NA
Q3 2022
10/27/2022
23.280.130.5244.8
Q2 2022
9/29/2022
24.52-3.22-12.88NA
Q2 2022
7/28/2022
30.320.190.7639.9
Q1 2022
6/29/2022
27.19-2.83-11.32NA
Q1 2022
4/28/2022
32.280.210.8438.4
Q4 2021
2/23/2022
44.770.361.4431.1
Q3 2021
1/6/2022
53.32-0.25-1.00NA
Q3 2021
10/28/2021
93.000.542.1643.1
Q2 2021
9/30/2021
77.920.040.16487.0
Q2 2021
7/29/2021
72.770.732.9224.9
Q1 2021
6/30/2021
92.200.050.20461.0
Q1 2021
4/29/2021
74.470.562.2433.2
Q4 2020
2/24/2021
72.930.261.0470.1
Q3 2020
1/7/2021
57.390.080.32179.3
Q3 2020
10/29/2020
62.210.502.0031.1
Q2 2020
10/1/2020
83.870.502.0041.9
Q2 2020
7/30/2020
76.190.722.8826.5
Q1 2020
7/8/2020
43.44-1.96-7.84NA
Q1 2020
4/30/2020
12.62-0.40-1.60NA
Q4 2019
3/13/2020
3.23-0.73-2.92NA
Q3 2019
1/8/2020
7.89-0.38-1.52NA
Q3 2019
11/12/2019
7.78-0.89-3.56NA
Q2 2019
10/2/2019
10.380.341.367.6
Q2 2019
8/8/2019
21.29-0.69-2.76NA
Q1 2019
7/10/2019
18.390.120.4838.3
Q1 2019
5/9/2019
13.43-1.18-4.72NA
Q4 2018
4/10/2019
16.561.204.803.4
Q4 2018
3/18/2019
19.28-1.02-4.08NA
Q3 2018
1/9/2019
15.640.180.7221.7
Q3 2018
11/8/2018
20.36-1.55-6.20NA
Q2 2018
9/26/2018
26.750.361.4418.6
Q2 2018
8/9/2018
38.60-2.20-8.80NA
Q1 2018
6/27/2018
29.250.321.2822.9
Q1 2018
5/8/2018
38.15-1.74-6.96NA
Q4 2017
4/11/2018
36.301.485.926.1
Q4 2017
3/15/2018
48.20-0.47-1.88NA
Q3 2017
12/20/2017
69.950.441.7639.7
Q3 2017
11/8/2017
40.10-0.03-0.12NA
Q2 2017
9/19/2017
24.550.783.127.9
Q2 2017
8/3/2017
16.45-0.29-1.16NA
Q1 2017
6/22/2017
16.450.582.327.1
Q1 2017
5/4/2017
15.40-0.06-0.24NA
Q4 2016
4/5/2017
17.251.847.362.3
Q4 2016
1/31/2017
16.600.120.4834.6
Q3 2016
12/21/2016
18.200.853.405.4
Q3 2016
11/3/2016
13.100.030.12109.2
Q2 2016
9/21/2016
15.451.114.443.5
Q2 2016
8/4/2016
16.19-0.04-0.16NA
Q1 2016
6/22/2016
16.670.803.205.2
Q1 2016
5/3/2016
14.490.080.3245.3
Q4 2015
4/6/2016
14.731.857.402.0
Q4 2015
2/9/2016
10.360.000.00NA
Q3 2015
1/7/2016
11.601.094.362.7
Q3 2015
11/9/2015
17.00-0.08-0.32NA
Q2 2015
9/24/2015
18.351.214.843.8
Q2 2015
8/6/2015
21.850.070.2878.0
Q1 2015
6/24/2015
22.030.933.725.9
Q1 2015
4/27/2015
25.070.110.4457.0
Q4 2014
4/8/2015
25.051.807.203.5
Q4 2014
1/29/2015
23.320.060.2497.2
Q3 2014
1/8/2015
23.561.194.764.9
Q3 2014
10/23/2014
19.490.070.2869.6
Q2 2014
9/23/2014
17.501.174.683.7
Q2 2014
7/24/2014
16.190.080.3250.6
Q1 2014
6/25/2014
15.920.933.724.3
Q1 2014
4/24/2014
17.510.160.6427.4
Q4 2013
1/30/2014
22.123.0112.041.8
Q3 2013
1/8/2014
29.801.124.486.7
Q3 2013
10/17/2013
25.830.140.5646.1
Q2 2013
9/25/2013
29.731.164.646.4
Q2 2013
7/18/2013
34.970.150.6058.3
Q1 2013
6/26/2013
26.750.923.687.3
Q1 2013
4/18/2013
15.700.321.2812.3
Q4 2012
1/24/2013
16.500.371.4811.1
Q3 2012
12/19/2012
14.041.034.123.4
Q3 2012
10/25/2012
13.500.110.4430.7
Q2 2012
9/19/2012
10.180.983.922.6
Q2 2012
7/19/2012
6.600.020.0882.5
Q1 2012
6/20/2012
6.940.893.561.9
Q1 2012
4/19/2012
5.900.120.4812.3
BBBY PE History Chart
PeriodPriceAdj. EPSTTMPE
Q2 2026
8/4/2026
5.56-0.53-1.13NA
Q1 2026
4/27/2026
5.34-0.25-0.82NA
Q4 2025
2/23/2026
5.07-0.16-0.99NA
Q3 2025
10/27/2025
8.60-0.19-1.74NA
Q2 2025
7/28/2025
10.30-0.22-2.51NA
Q1 2025
4/28/2025
4.18-0.42-3.05NA
Q4 2024
2/24/2025
6.92-0.91-3.85NA
Q3 2024
10/24/2024
6.69-0.96-4.16NA
Q2 2024
7/29/2024
13.59-0.76-3.20NA
Q1 2024
5/6/2024
21.89-1.22-3.05NA
Q4 2023
2/20/2024
27.18-1.22-1.83NA
Q3 2023
10/26/2023
15.40-0.61-0.63NA
Q2 2023
7/27/2023
35.02-0.02-0.12NA
Q1 2023
4/27/2023
20.13-0.10-3.66NA
Q4 2022
2/22/2023
20.53-0.04-6.78NA
Q3 2022
1/10/2023
20.16-3.65-6.55NA
Q3 2022
10/27/2022
23.280.13-5.73NA
Q2 2022
9/29/2022
24.52-3.22-5.65NA
Q2 2022
7/28/2022
30.320.19-2.07NA
Q1 2022
6/29/2022
27.19-2.83-2.51NA
Q1 2022
4/28/2022
32.280.210.8637.5
Q4 2021
2/23/2022
44.770.360.6964.9
Q3 2021
1/6/2022
53.32-0.251.0650.3
Q3 2021
10/28/2021
93.000.541.3668.4
Q2 2021
9/30/2021
77.920.041.3856.5
Q2 2021
7/29/2021
72.770.731.6045.5
Q1 2021
6/30/2021
92.200.050.9597.1
Q1 2021
4/29/2021
74.470.561.4053.2
Q4 2020
2/24/2021
72.930.261.3454.4
Q3 2020
1/7/2021
57.390.081.8031.9
Q3 2020
10/29/2020
62.210.50-0.24NA
Q2 2020
10/1/2020
83.870.50-1.14NA
Q2 2020
7/30/2020
76.190.72-2.37NA
Q1 2020
7/8/2020
43.44-1.96-3.47NA
Q1 2020
4/30/2020
12.62-0.40-2.40NA
Q4 2019
3/13/2020
3.23-0.73-1.66NA
Q3 2019
1/8/2020
7.89-0.38-1.62NA
Q3 2019
11/12/2019
7.78-0.89-1.12NA
Q2 2019
10/2/2019
10.380.34-1.41NA
Q2 2019
8/8/2019
21.29-0.69-0.55NA
Q1 2019
7/10/2019
18.390.12-0.88NA
Q1 2019
5/9/2019
13.43-1.18-0.82NA
Q4 2018
4/10/2019
16.561.20-1.19NA
Q4 2018
3/18/2019
19.28-1.02-2.03NA
Q3 2018
1/9/2019
15.640.18-3.21NA
Q3 2018
11/8/2018
20.36-1.55-3.07NA
Q2 2018
9/26/2018
26.750.36-3.26NA
Q2 2018
8/9/2018
38.60-2.20-2.14NA
Q1 2018
6/27/2018
29.250.32-0.41NA
Q1 2018
5/8/2018
38.15-1.74-0.29NA
Q4 2017
4/11/2018
36.301.481.4225.6
Q4 2017
3/15/2018
48.20-0.470.7266.9
Q3 2017
12/20/2017
69.950.440.9077.7
Q3 2017
11/8/2017
40.10-0.031.0438.6
Q2 2017
9/19/2017
24.550.781.0124.3
Q2 2017
8/3/2017
16.45-0.292.077.9
Q1 2017
6/22/2017
16.450.582.486.6
Q1 2017
5/4/2017
15.40-0.062.755.6
Q4 2016
4/5/2017
17.251.842.846.1
Q4 2016
1/31/2017
16.600.122.117.9
Q3 2016
12/21/2016
18.200.851.959.3
Q3 2016
11/3/2016
13.100.031.906.9
Q2 2016
9/21/2016
15.451.111.957.9
Q2 2016
8/4/2016
16.19-0.042.696.0
Q1 2016
6/22/2016
16.670.802.736.1
Q1 2016
5/3/2016
14.490.083.024.8
Q4 2015
4/6/2016
14.731.852.865.2
Q4 2015
2/9/2016
10.360.002.224.7
Q3 2015
1/7/2016
11.601.092.295.1
Q3 2015
11/9/2015
17.00-0.082.138.0
Q2 2015
9/24/2015
18.351.212.327.9
Q2 2015
8/6/2015
21.850.072.917.5
Q1 2015
6/24/2015
22.030.932.907.6
Q1 2015
4/27/2015
25.070.113.167.9
Q4 2014
4/8/2015
25.051.803.128.0
Q4 2014
1/29/2015
23.320.062.499.4
Q3 2014
1/8/2015
23.561.192.519.4
Q3 2014
10/23/2014
19.490.072.258.7
Q2 2014
9/23/2014
17.501.172.347.5
Q2 2014
7/24/2014
16.190.084.183.9
Q1 2014
6/25/2014
15.920.935.223.0
Q1 2014
4/24/2014
17.510.164.434.0
Q4 2013
1/30/2014
22.123.015.434.1
Q3 2013
1/8/2014
29.801.122.5711.6
Q3 2013
10/17/2013
25.830.142.3710.9
Q2 2013
9/25/2013
29.731.162.5511.7
Q2 2013
7/18/2013
34.970.151.7619.9
Q1 2013
6/26/2013
26.750.922.6410.1
Q1 2013
4/18/2013
15.700.321.838.6
Q4 2012
1/24/2013
16.500.372.496.6
Q3 2012
12/19/2012
14.041.032.146.6
Q3 2012
10/25/2012
13.500.112.006.8
Q2 2012
9/19/2012
10.180.982.015.1
Q2 2012
7/19/2012
6.600.02NANA
Q1 2012
6/20/2012
6.940.89NANA
Q1 2012
4/19/2012
5.900.12NANA
Quotes delayed 20 minutes

Email EnvelopeFree BBBY Email Alerts:
Get Dividend Alerts
Get SEC Filing Alerts
10 Most Oversold S&P 500 Stocks
10 Most Overbought S&P 500 Stocks
10 ETFs With Stocks Insiders Are Buying
10 ETFs With Most Upside To Targets
The DividendRank Top 25
Warren Buffett Dividend Stocks
10 Cheap Dividend Stocks Under $10
10 Top DividendRank'ed Energy Stocks
The 10 Highest Yielding Preferred Stocks
The 15 Most Active S&P Call & Put Options
Bed Bath & Beyond (BBBY) is categorized under the Services sector; to help you further research PE history across stocks, below are some other companies in the same sector:

BBGI Historical PE Ratio
BBQ Historical PE Ratio
BBW Historical PE Ratio
BBWI Historical PE Ratio
BBY Historical PE Ratio
BFAM Historical PE Ratio
BFI Historical PE Ratio
BGFV Historical PE Ratio
BH Historical PE Ratio
BHR Historical PE Ratio
How should the BBBY historical PE ratio be determined?
Realizing that PE stands for Price to Earnings ratio, we need two values to compute it: stock price and earnings per share. The stock price at any given date is a known historical value, but what about the earnings number to use?

✔️Accepted answer: There are a number of different approaches when it comes to calculating a historical PE ratio for a company like Bed Bath & Beyond. We like to take our measurements on each of the past quarterly earnings reports. That only leaves the question of whether the earnings number at that quarterly report should be used on an annualized basis, or some other method. We approach this question using three different methods, on this BBBY Historical PE Ratio page.

What is the average historical PE for BBBY based on annualized quarterly earnings?
As we look back through earnings history, what is the resulting PE calculation if at each measurement period we use that quarter's earnings result annualized?

✔️Accepted answer: The BBBY historical PE ratio using the annualized quarterly earnings method works out to 44.5.

What is the average historical PE for BBBY based on trailing twelve month earnings?
As we look back through earnings history, what is the resulting PE calculation if at each measurement period we use the trailing twelve months combined earnings result in the calculation?

✔️Accepted answer: The BBBY historical PE ratio using the TTM earnings method works out to 20.3.

On this page we presented the BBBY Historical PE Ratio information for Bed Bath & Beyond' stock. The average BBBY historical PE based on using the annualized quarterly earnings result at each measurement period (for the "E" in the PE calculation; and the closing price on earnings date as the "P") is 44.5. Meanwhile, using the trailing twelve month (TTM) quarterly earnings result as our method of calculation the "E" value at each measurement period, the average BBBY historical PE based on this TTM earnings result method is 20.3. Note: any PE calculations involving negative earnings were discarded as not meaningful.

Let's now compare this BBBY historical PE result, against the recent PE: when this page was posted on 8/14/2026, the most recent closing price for BBBY had been 4.35, and the most recent quarterly earnings result, annualized, was 0.52. Meanwhile, the most recent TTM earnings summed to 0.86. From these numbers, we calculate the recent BBBY PE on 8/14/2026 based on annualized quarterly EPS was 8.4. Based on BBBY's history, that recent PE is low relative to the historical average, with the recent PE 81.1% lower than the historical average PE across our data set for Bed Bath & Beyond. Looking at the recent BBBY PE on 8/14/2026 based on TTM EPS, we calculate the ratio at 5.1. Based on BBBY's history, that recent PE is low relative to the historical average, with the recent PE 74.9% lower than the average PE across our Bed Bath & Beyond data set with TTM EPS used in the calculation at each period.

For self directed investors doing their due diligence on BBBY or any other given stock, valuation analysis for BBBY can greatly benefit from studying the past earnings and resulting PE calculations. This exercise can help inform an analysis as to whether the past earnings trajectory and current versus historical PE ratios justify the current stock value.

That's why we bring you HistoricalPERatio.com to make it easy for investors to investigate Bed Bath & Beyond PE history or the past PE information for any stock in our coverage universe. And in your continued research we hope you will be sure to check out the further links included for earnings surprises history (beat/miss data) as well as next earnings dates for BBBY. Thanks for visiting, and the next time you need to research BBBY Historical PE Ratio or the ratio for another stock, we hope you'll think of our site, as your go-to historical PE ratio research resource of choice.
 

BBBY Historical PE Ratio | www.HistoricalPERatio.com | Copyright © 2020 - 2026, All Rights Reserved

Nothing in HistoricalPERatio.com is intended to be investment advice, nor does it represent the opinion of, counsel from, or recommendations by BNK Invest Inc. or any of its affiliates, subsidiaries or partners. None of the information contained herein constitutes a recommendation that any particular security, portfolio, transaction, or investment strategy is suitable for any specific person. All viewers agree that under no circumstances will BNK Invest, Inc,. its subsidiaries, partners, officers, employees, affiliates, or agents be held liable for any loss or damage caused by your reliance on information obtained. By visiting, using or viewing this site, you agree to the following Full Disclaimer & Terms of Use and Privacy Policy. Video widget and market videos powered by Market News Video. Quote and option data delayed at least 15 minutes; stock quote data powered by Ticker Technologies, and Mergent.
X
Wait! Don't leave yet.
Want to receive our latest research absolutely free?
⤹


Click the button below for your complimentary copy of Your Early Retirement Portfolio: Dividends Up to 8.7%—Every Month—Forever.

You'll discover the details on 4 stocks and funds that pay you massive dividends as high as 8.7%.
