 This GAIA PE ratio history page last updated 3/29/2024
|
| Period | Price | GAAP | TTM | PE |
|---|
Q4 2023
3/27/2024 | 2.90 | -0.08 | -0.24 | NA | Q3 2023
10/30/2023 | 2.54 | -0.03 | -0.20 | NA | Q2 2023
7/31/2023 | 2.35 | -0.08 | -0.28 | NA | Q1 2023
5/1/2023 | 3.00 | -0.05 | -0.19 | NA | Q4 2022
3/6/2023 | 2.63 | -0.04 | -0.13 | NA | Q3 2022
11/7/2022 | 2.29 | -0.11 | 0.01 | 229.0 | Q2 2022
8/1/2022 | 3.76 | 0.01 | 0.15 | 25.1 | Q1 2022
5/2/2022 | 5.00 | 0.01 | 0.17 | 29.4 | Q4 2021
2/28/2022 | 6.79 | 0.10 | 0.18 | 37.7 | Q3 2021
11/1/2021 | 10.09 | 0.03 | 0.10 | 100.9 | Q2 2021
8/2/2021 | 12.07 | 0.03 | 0.08 | 150.9 | Q1 2021
5/3/2021 | 11.52 | 0.02 | -0.08 | NA | Q4 2020
3/1/2021 | 10.64 | 0.02 | -0.29 | NA | Q3 2020
11/9/2020 | 11.21 | 0.01 | -0.46 | NA | Q2 2020
8/3/2020 | 10.00 | -0.13 | -0.70 | NA | Q1 2020
4/27/2020 | 10.16 | -0.19 | -0.82 | NA | Q4 2019
2/24/2020 | 10.27 | -0.15 | -1.01 | NA | Q3 2019
11/4/2019 | 7.34 | -0.23 | -1.48 | NA | Q2 2019
8/5/2019 | 5.90 | -0.25 | -1.83 | NA | Q1 2019
4/29/2019 | 9.29 | -0.38 | -1.93 | NA | Q4 2018
3/4/2019 | 11.40 | -0.62 | -1.94 | NA | Q3 2018
11/5/2018 | 15.67 | -0.58 | -1.69 | NA | Q2 2018
8/6/2018 | 18.15 | -0.35 | -1.48 | NA | Q1 2018
5/7/2018 | 15.95 | -0.39 | -1.55 | NA | Q4 2017
2/26/2018 | 13.35 | -0.37 | -1.57 | NA | Q3 2017
11/6/2017 | 12.60 | -0.37 | -1.43 | NA | Q2 2017
8/7/2017 | 12.85 | -0.42 | -1.07 | NA | Q1 2017
5/1/2017 | 10.80 | -0.41 | -0.78 | NA | Q4 2016
2/27/2017 | 8.40 | -0.23 | -0.68 | NA | Q3 2016
11/3/2016 | 7.70 | -0.01 | -0.37 | NA | Q2 2016
8/8/2016 | 8.13 | -0.13 | -0.28 | NA | Q1 2016
5/10/2016 | 6.71 | -0.31 | -0.15 | NA | Q4 2015
3/15/2016 | 5.62 | 0.08 | 0.04 | 140.5 | Q3 2015
11/5/2015 | 6.71 | 0.08 | -0.01 | NA | Q2 2015
8/6/2015 | 6.45 | 0.00 | -0.21 | NA | Q1 2015
5/7/2015 | 6.72 | -0.12 | -0.31 | NA | Q4 2014
3/12/2015 | 7.12 | 0.03 | -0.28 | NA | Q3 2014
11/10/2014 | 7.56 | -0.12 | -0.41 | NA | Q2 2014
8/6/2014 | 7.24 | -0.10 | -0.28 | NA | Q1 2014
5/8/2014 | 6.57 | -0.09 | 0.17 | 38.6 | Q4 2013
3/18/2014 | 6.52 | -0.10 | 0.25 | 26.1 | Q3 2013
11/7/2013 | 6.30 | 0.01 | 0.44 | 14.3 | Q2 2013
8/7/2013 | 5.76 | 0.35 | 0.42 | 13.7 | Q1 2013
5/7/2013 | 4.48 | -0.01 | NA | NA | Q4 2012
3/18/2013 | 3.70 | 0.09 | NA | NA | Q3 2012
11/5/2012 | 3.20 | -0.01 | NA | NA |
|

|
| Period | Price | GAAP | Annualized | PE |
|---|
Q4 2023
3/27/2024 | 2.90 | -0.08 | -0.32 | NA | Q3 2023
10/30/2023 | 2.54 | -0.03 | -0.12 | NA | Q2 2023
7/31/2023 | 2.35 | -0.08 | -0.32 | NA | Q1 2023
5/1/2023 | 3.00 | -0.05 | -0.20 | NA | Q4 2022
3/6/2023 | 2.63 | -0.04 | -0.16 | NA | Q3 2022
11/7/2022 | 2.29 | -0.11 | -0.44 | NA | Q2 2022
8/1/2022 | 3.76 | 0.01 | 0.04 | 94.0 | Q1 2022
5/2/2022 | 5.00 | 0.01 | 0.04 | 125.0 | Q4 2021
2/28/2022 | 6.79 | 0.10 | 0.40 | 17.0 | Q3 2021
11/1/2021 | 10.09 | 0.03 | 0.12 | 84.1 | Q2 2021
8/2/2021 | 12.07 | 0.03 | 0.12 | 100.6 | Q1 2021
5/3/2021 | 11.52 | 0.02 | 0.08 | 144.0 | Q4 2020
3/1/2021 | 10.64 | 0.02 | 0.08 | 133.0 | Q3 2020
11/9/2020 | 11.21 | 0.01 | 0.04 | 280.2 | Q2 2020
8/3/2020 | 10.00 | -0.13 | -0.52 | NA | Q1 2020
4/27/2020 | 10.16 | -0.19 | -0.76 | NA | Q4 2019
2/24/2020 | 10.27 | -0.15 | -0.60 | NA | Q3 2019
11/4/2019 | 7.34 | -0.23 | -0.92 | NA | Q2 2019
8/5/2019 | 5.90 | -0.25 | -1.00 | NA | Q1 2019
4/29/2019 | 9.29 | -0.38 | -1.52 | NA | Q4 2018
3/4/2019 | 11.40 | -0.62 | -2.48 | NA | Q3 2018
11/5/2018 | 15.67 | -0.58 | -2.32 | NA | Q2 2018
8/6/2018 | 18.15 | -0.35 | -1.40 | NA | Q1 2018
5/7/2018 | 15.95 | -0.39 | -1.56 | NA | Q4 2017
2/26/2018 | 13.35 | -0.37 | -1.48 | NA | Q3 2017
11/6/2017 | 12.60 | -0.37 | -1.48 | NA | Q2 2017
8/7/2017 | 12.85 | -0.42 | -1.68 | NA | Q1 2017
5/1/2017 | 10.80 | -0.41 | -1.64 | NA | Q4 2016
2/27/2017 | 8.40 | -0.23 | -0.92 | NA | Q3 2016
11/3/2016 | 7.70 | -0.01 | -0.04 | NA | Q2 2016
8/8/2016 | 8.13 | -0.13 | -0.52 | NA | Q1 2016
5/10/2016 | 6.71 | -0.31 | -1.24 | NA | Q4 2015
3/15/2016 | 5.62 | 0.08 | 0.32 | 17.6 | Q3 2015
11/5/2015 | 6.71 | 0.08 | 0.32 | 21.0 | Q2 2015
8/6/2015 | 6.45 | 0.00 | 0.00 | NA | Q1 2015
5/7/2015 | 6.72 | -0.12 | -0.48 | NA | Q4 2014
3/12/2015 | 7.12 | 0.03 | 0.12 | 59.3 | Q3 2014
11/10/2014 | 7.56 | -0.12 | -0.48 | NA | Q2 2014
8/6/2014 | 7.24 | -0.10 | -0.40 | NA | Q1 2014
5/8/2014 | 6.57 | -0.09 | -0.36 | NA | Q4 2013
3/18/2014 | 6.52 | -0.10 | -0.40 | NA | Q3 2013
11/7/2013 | 6.30 | 0.01 | 0.04 | 157.5 | Q2 2013
8/7/2013 | 5.76 | 0.35 | 1.40 | 4.1 | Q1 2013
5/7/2013 | 4.48 | -0.01 | -0.04 | NA | Q4 2012
3/18/2013 | 3.70 | 0.09 | 0.36 | 10.3 | Q3 2012
11/5/2012 | 3.20 | -0.01 | -0.04 | NA |
|
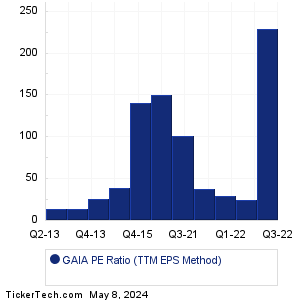
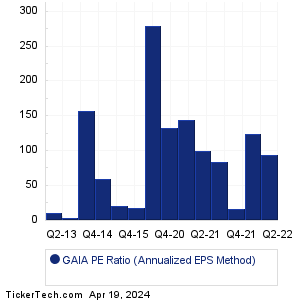
On this page we presented the Gaia PE Ratio History information for Gaia' stock.
The average GAIA PE ratio history based on using the annualized quarterly earnings result at each measurement period (for the "E" in the PE calculation; and the closing price on earnings date as the "P") is 89.1. Meanwhile, using the trailing twelve month (TTM) quarterly earnings result as our method of calculation the "E" value at each measurement period, the average GAIA PE ratio history based on this TTM earnings result method is 73.3. Note: any PE calculations involving negative earnings were discarded as not meaningful.
Let's now compare this GAIA PE ratio history result, against the recent PE: when this page was posted on 3/28/2024, the most recent closing price for GAIA had been 3.08, and the most recent quarterly earnings result, annualized, was 0.04. Meanwhile, the most recent TTM earnings summed to 0.01. From these numbers, we calculate the recent GAIA PE on 3/28/2024 based on annualized quarterly EPS was 77.0. Based on GAIA's history, that recent PE is low relative to the historical average, with the recent PE 13.6% lower than the historical average PE across our data set for Gaia. Looking at the recent GAIA PE on 3/28/2024 based on TTM EPS, we calculate the ratio at 308.0. Based on GAIA's history, that recent PE is elevated relative to the historical average, with the recent PE 320.2% higher than the historical average PE across our Gaia data set with TTM EPS used in the calculation at each period.
For self directed investors doing their due diligence on GAIA or any other given stock, valuation analysis for GAIA
can greatly benefit from studying the past earnings and resulting PE ratio history calculations. This type of study can
help inform an analysis as to whether the earnings trajectory over time and current versus historical average PE ratios
justify the current stock market value.
That's why we bring you HistoricalPERatio.com to make it easy for investors to investigate
Gaia PE ratio history — or the PE history for any stock in our coverage universe.
And in your continued research we hope you will be sure to check out the further links included for
next earnings dates and also historical earnings surprises history for GAIA. Thanks for visiting, and the next
time you need to research GAIA PE Ratio History or the PE ratio history for another stock, we hope our site
will come to mind as your go-to PE ratio history research resource of choice.